H&R REIT Reports Second Quarter 2026 Financial Results
Canada NewsWire
TORONTO, Aug. 12, 2026
TORONTO, Aug. 12, 2026 /CNW/ -- H&R Real Estate Investment Trust ("H&R" or "the REIT") (TSX: HR.UN) is pleased to announce its financial results for the three and six months ended June 30, 2026.
H&R TO BE ACQUIRED IN $6.7 BILLION TRANSACTION
On August 11, 2026, the REIT announced that it had entered into an arrangement agreement with GO Residential Real Estate Investment Trust ("GO REIT") and 1001700058 Ontario Inc. ("Purchaser"), on behalf of a consortium of co-purchasers (which includes funds affiliated with Blackstone Real Estate, Crestpoint Real Estate Investments Ltd., the Public Sector Pension Investment Board and a company controlled by members of the family of Tom Hofstedter, Executive Chairman and CEO of the REIT ("CRAL") (collectively, the "Asset Purchasers"), pursuant to which GO REIT and the Purchaser (on behalf of the Asset Purchasers) have agreed to acquire all of the assets of H&R by way of a court-approved plan of arrangement under the Business Corporations Act (Alberta) in a cash and unit transaction valued at approximately $6.7 billion, including the assumption of certain debt (the "Transaction").
Under the terms of the Arrangement Agreement, H&R unitholders will receive $4.28 per unit in cash plus 0.5688 GO REIT units per H&R Unit, representing a value of $12.01 per H&R Unit based on the closing unit price of GO REIT on the TSX and a prevailing Canadian/U.S. dollar exchange rate of 1.3942 on August 10, 2026. As partial consideration for CRAL's purchase price, CRAL will have its Units, together with Units owned or controlled by certain of its affiliates and associates as well as the Units of the CEO of the REIT, redeemed and ultimately cancelled. Such Units will not receive any GO REIT units or cash consideration pursuant to the Transaction. A total of 44,038,986 Units are expected to be cancelled. The Transaction is expected to close in the fourth quarter of 2026, subject to unitholder, court, and regulatory approvals and other customary closing conditions.
The Transaction concludes H&R's multi-year strategy to simplify its portfolio and focus on high-quality residential assets, delivers immediate cash and GO REIT unit consideration at a premium, and provides H&R unitholders with a 66.9% ownership stake in GO REIT on a pro forma basis.
SUMMARY OF SIGNIFICANT Q2 2026 ACTIVITY
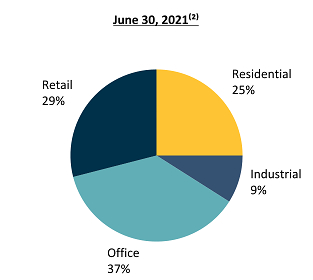
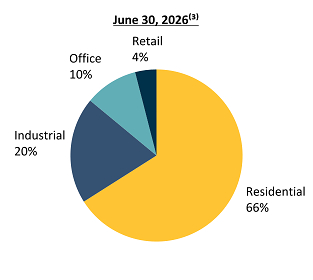
(1) | At the REIT's proportionate share, excluding assets classified as held for sale. Refer to the "Non-GAAP Measures" section of this news release. |
(2) | June 30, 2021 has been used as a benchmark since H&R's strategic repositioning plan was announced prior to the release of H&R's Q3 2021 results. |
(3) | Excludes the Bow and 100 Wynford, which were legally sold in October 2021 and August 2022, respectively. |
FINANCIAL HIGHLIGHTS
June 30 | December 31 | December 31 | |
2026 | 2025 | 2024 | |
Total assets (in thousands) | $8,117,383 | $9,108,286 | $10,620,487 |
Debt to total assets per the REIT's Financial Statements(1) | 30.9 % | 38.4 % | 33.4 % |
Debt to total assets at the REIT's proportionate share(1)(2) | 41.8 % | 49.8 % | 43.7 % |
Debt to Adjusted EBITDA at the REIT's proportionate share(1)(2)(3) | 7.1x | 9.3x | 9.4x |
Unitholders' equity (in thousands) | $4,188,885 | $4,135,718 | $5,278,743 |
Units outstanding (in thousands) | 264,637 | 264,558 | 262,016 |
Exchangeable units outstanding (in thousands) | 15,372 | 15,442 | 17,974 |
Unitholders' equity per Unit | $15.83 | $15.63 | $20.15 |
Net Asset Value ("NAV") per Unit(2)(4) | $16.23 | $16.09 | $20.92 |
Three months ended June 30 | Six months ended June 30 | |||
(in thousands except for per Unit amounts) | 2026 | 2025 | 2026 | 2025 |
Rentals from investment properties | $169,780 | $204,011 | $354,033 | $409,650 |
Net operating income | $117,010 | $143,826 | $202,879 | $226,789 |
Same-Property net operating income (cash basis)(5) | $106,914 | $93,373 | $196,912 | $186,777 |
Net income from equity accounted investments | $11,235 | $26,780 | $3,971 | $16,698 |
Fair value adjustment on real estate assets | ($44,845) | ($280,656) | ($123,898) | ($333,354) |
Net income (loss) | $37,135 | ($166,370) | $2,265 | ($218,388) |
Funds from Operations ("FFO")(5) | $69,085 | $87,804 | $145,350 | $170,902 |
Adjusted Funds from Operations ("AFFO")(5) | $73,517 | $73,380 | $139,016 | $141,393 |
Weighted average number of Units and exchangeable units | 280,009 | 279,990 | 280,006 | 279,990 |
FFO per basic and diluted Unit(2) | $0.247 | $0.314 | $0.519 | $0.610 |
AFFO per basic and diluted Unit(2) | $0.263 | $0.262 | $0.496 | $0.505 |
Cash distributions per Unit | $0.150 | $0.150 | $0.300 | $0.300 |
Payout ratio as a % of FFO(2) | 60.7 % | 47.8 % | 57.8 % | 49.2 % |
Payout ratio as a % of AFFO(2) | 57.0 % | 57.3 % | 60.5 % | 59.4 % |
(1) | Debt includes mortgages payable, debentures payable, unsecured term loans and lines of credit. |
(2) | These are non-GAAP ratios. Refer to the "Non-GAAP Measures" section of this news release. |
(3) | Adjusted EBITDA is based on the trailing 12 months and is calculated on page 8 of this news release. |
(4) | See page 11 of this news release for a detailed calculation of NAV per Unit. |
(5) | These are non-GAAP measures. Refer to the "Non-GAAP Measures" section of this news release. |
Included in AFFO for the three and six months ended June 30, 2026 is the add back of straight-lining of contractual rent relating to the 200 Bouchard Lease Termination Payment (as defined in the "Leasing Update" section below), equating to approximately $0.06 per Unit. Excluding this straight-lining of contractual rent adjustment, AFFO decreased by $15.6 million and $18.1 million for the three and six months ended June 30, 2026 compared to the respective 2025 periods.
Net Operating Income Highlights:
Three months ended June 30 | Six months ended June 30 | |||||
(in thousands of Canadian dollars) | 2026 | 2025 | % Change | 2026 | 2025 | % Change |
Operating Segment: | ||||||
Same-Property net operating income (cash basis) - Residential(1) | $43,711 | $43,780 | (0.2 %) | $86,960 | $87,912 | (1.1 %) |
Same-Property net operating income (cash basis) - Industrial(1) | 18,405 | 18,526 | (0.7 %) | 36,092 | 37,192 | (3.0 %) |
Same-Property net operating income (cash basis) - Office(1) | 40,104 | 26,069 | 53.8 % | 64,305 | 52,336 | 22.9 % |
Same-Property net operating income (cash basis) - Retail(1) | 4,694 | 4,998 | (6.1 %) | 9,555 | 9,337 | 2.3 % |
Same-Property net operating income (cash basis)(1) | 106,914 | 93,373 | 14.5 % | 196,912 | 186,777 | 5.4 % |
Net operating income (cash basis) from Transactions at the REIT's proportionate share(1)(2) | 28,159 | 61,969 | (54.6 %) | 73,556 | 123,908 | (40.6 %) |
Realty taxes in accordance with IFRIC 21 at the REIT's proportionate share(1)(3) | 10,403 | 16,820 | (38.2 %) | (22,467) | (32,374) | (30.6 %) |
Straight-lining of contractual rent at the REIT's proportionate share(1) | (12,526) | 3,861 | (424.4 %) | (9,308) | 7,519 | (223.8 %) |
Net operating income from equity accounted investments(1) | (15,940) | (32,197) | (50.5 %) | (35,814) | (59,041) | (39.3 %) |
Net operating income per the REIT's Financial Statements | $117,010 | $143,826 | (18.6 %) | $202,879 | $226,789 | (10.5 %) |
(1) | These are non-GAAP measures. Refer to the "Non-GAAP Measures" section of this news release. |
(2) | Transactions includes acquisitions, dispositions, and transfers of investment properties to or from properties under development during the 18-month period ended June 30, 2026. |
(3) | Realty taxes in accordance with IFRS Interpretations Committee Interpretation 21, Levies ("IFRIC 21") relates to the timing of the liability recognition for U.S. realty taxes. By excluding the impact of IFRIC 21, U.S. realty tax expenses are evenly matched with realty tax recoveries received from tenants throughout the period. |
Same-Property net operating income (cash basis) from office properties increased by 53.8% and 22.9%, respectively, for the three and six months ended June 30, 2026 compared to the respective 2025 periods, primarily due to the 200 Bouchard Lease Termination Payment (as defined below), partially offset by the expiration of Royal Bank of Canada's lease for 188,526 square feet at 330 Front Street West, in Toronto, ON on December 31, 2025.
Straight-lining of contractual rent at the REIT's proportionate share decreased by 424.4% and 223.8%, respectively, for the three and six months ended June 30, 2026 compared to the respective 2025 periods, primarily due to the accounting under IFRS 16, Leases ("IFRS 16") relating to the 200 Bouchard Lease Termination Payment (as defined in the "Leasing Update" section below).
Fair Value Adjustment on Real Estate Assets | Three months ended June 30 | Six months ended June 30 | ||||
(in thousands of Canadian dollars) | 2026 | 2025 | Change | 2026 | 2025 | Change |
Operating Segment: | ||||||
Residential | ($37,917) | ($35,732) | ($2,185) | ($54,670) | ($38,243) | ($16,427) |
Industrial | (2,809) | (45,889) | 43,080 | 11,521 | (63,108) | 74,629 |
Office | (93,872) | (108,028) | 14,156 | (164,464) | (138,784) | (25,680) |
Retail | (824) | (7,473) | 6,649 | (2,268) | (2,041) | (227) |
Land and properties under development | 92,492 | (74,389) | 166,881 | 70,427 | (105,918) | 176,345 |
Fair value adjustment on real estate assets per the REIT's proportionate share(1) | (42,930) | (271,511) | 228,581 | (139,454) | (348,094) | 208,640 |
Less: equity accounted investments | (1,915) | (9,145) | 7,230 | 15,556 | 14,740 | 816 |
Fair value adjustment on real estate assets per the REIT's Financial Statements | ($44,845) | ($280,656) | $235,811 | ($123,898) | ($333,354) | $209,456 |
(1) | The REIT's proportionate share is a non-GAAP measure defined in the "Non-GAAP Measures" section of this news release. |
During the three and six months ended June 30, 2026, fair value adjustments on real estate assets were primarily due to the following: (i) a reduction in valuations of certain office properties to reflect increased leasing uncertainty and vacancy risk; and (ii) an increase in valuation of vacant industrial land in Caledon, ON, which was reclassified to assets held for sale during Q2 2026.
Transaction Highlights
Assets Classified as Held for Sale
As at June 30, 2026, H&R had one wholly-owned office property, a 98.5% interest in one office property, one wholly-owned industrial property, a 50% interest in two industrial properties and one wholly-owned industrial property under development classified as held for sale totalling $735.7 million. In addition, H&R had a 31.7% interest in one residential property within equity accounted investments classified as held for sale for $37.5 million.
In July 2026, H&R sold its 98.5% interest in one office property and its 50% interest in one industrial property, which were each classified as held for sale as at June 30, 2026, for aggregate gross proceeds of approximately $78.1 million.
Leasing Update
H&R previously announced in Q3 2022 that it had entered into a lease amendment with Bell Canada to terminate their lease at 200 Bouchard Boulevard, Montreal, QC ("200 Bouchard") in December 2026. As part of this lease amendment, H&R received a lease termination payment of approximately $15.7 million in Q2 2026 ("200 Bouchard Lease Termination Payment"). IFRS 16 requires revenue from leases to be recognized on a straight-line basis over the contractual term of the lease, therefore, the related non-cash adjustment to straight-lining of contractual rent of approximately ($15.7) million was recorded in Q2 2026. Therefore, the 200 Bouchard Lease Termination Payment had no impact on net operating income and FFO (as defined below) for Q2 2026. However, Same-Property net operating income (cash basis) and AFFO (as defined below) were positively impacted by $15.7 million as H&R deducts non-cash items, including straight-lining of contractual rent, in calculating these amounts. Same-Property net operating income (cash basis), FFO and AFFO are non-GAAP measures. Refer to the "Non-GAAP Measures" section of this news release.
In July 2026, the 200 Bouchard lease was further amended to advance the lease termination date to August 2026, which resulted in H&R receiving the final lease termination payment ("200 Bouchard Final Lease Termination Payment") of $56.1 million in July 2026. As a result of the 200 Bouchard Final Lease Termination Payment, in Q3 2026, H&R expects to record a related non-cash adjustment to straight-lining of contractual rent of ($47.3) million to write off the remaining accrued rent receivable. Accordingly, 200 Bouchard is expected to contribute $9.3 million to net operating income and FFO in Q3 2026 compared to $5.4 million in Q2 2026. Furthermore, 200 Bouchard's contribution to Same-Property net operating income (cash basis) is expected to be $56.6 million in Q3 2026 compared to $17.3 million in Q2 2026. Same-Property net operating income (cash basis), FFO and AFFO are non-GAAP measures. Refer to the "Non-GAAP Measures" section of this news release.
Development Update
Equity Accounted Investments
H&R has a 50% managing ownership interest in 560 & 600 Slate Drive, a 26.6 acre land site in Mississauga, ON, located next to Toronto Pearson International Airport and in close proximity to access points on the 410, 401 and 407 Highways. In 2024, construction commenced on two single storey industrial buildings totalling 312,218 square feet and 162,395 square feet, respectively, at the 100% level. The buildings include sustainability elements such as EV charging stations and solar panel readiness and are targeting LEED Gold certification. Both properties have been leased at market rents for approximately 11 years to a single tenant. The lease at 560 Slate Drive commenced in March 2026 and the lease at 600 Slate Drive will commence in October 2026, with a 5-month rent free period at both properties commencing at the start of the respective lease term. The properties reached substantial completion in June 2026, and were transferred from properties under development to investment properties. As at June 30, 2026, the total budget for 560 & 600 Slate Drive was approximately $65.5 million with costs remaining to complete of $6.2 million, all at H&R's ownership interest. The yield on cost for the overall project is expected to be approximately 6.5%.
Debt & Liquidity Highlights.
Debentures
In June 2026, H&R redeemed all of its $250.0 million Series R Senior Debentures upon maturity, which bore interest at 2.906% per annum. The redemption was primarily funded using unsecured operating lines of credit.
Liquidity
As at June 30, 2026, H&R had cash and cash equivalents of $59.1 million and $703.2 million available under its unused lines of credit. H&R has an unencumbered property pool of approximately $3.3 billion, which is 3.21x unsecured debt.
As at June 30, 2026, debt to total assets per the REIT's Financial Statements was 30.9% compared to 38.4% as at December 31, 2025. As at June 30, 2026, debt to total assets at the REIT's proportionate share (a non-GAAP ratio, refer to the "Non-GAAP Measures" section of this news release) was 41.8% compared to 49.8% as at December 31, 2025. Debt to Adjusted EBITDA at the REIT's proportionate share (a non-GAAP ratio, refer to the "Non-GAAP Measures" section of this news release) was 7.1x as at June 30, 2026 compared to 9.3x as at December 31, 2025. The decrease in these financial metrics is primarily due to proceeds from the $1.5 billion of retail and office property sales in Q1 2026 being used to repay debt.
CONFERENCE CALL AND WEBCAST
Management will host a conference call to discuss the financial results of the REIT on Thursday, August 13, 2026 at 9.30 a.m. Eastern Time. Participants can join the call by dialing 1‐800‐717‐1738 or 1‐289‐514‐5100. For those unable to participate in the conference call at the scheduled time, a replay will be available approximately one hour following completion of the call. To access the archived conference call by telephone, dial 1‐289‐819‐1325 or 1‐888‐660‐6264 and enter the passcode 78930 followed by the "#" key. The telephone replay will be available until Thursday, August 20, 2026 at midnight.
A live audio webcast will be available through www.hr-reit.com/investor-relations/#investor-events. Please connect at least 15 minutes prior to the conference call to ensure adequate time for any software download that may be required to join the webcast. The webcast will be archived on H&R's website following the call date.
The investor presentation is available on H&R's website at www.hr-reit.com/investor-relations/#investor-presentation.
ABOUT H&R REIT
H&R is one of Canada's largest real estate investment trusts. H&R has ownership interests in a Canadian and U.S. portfolio primarily comprised of high‐quality residential (operating as Lantower Residential), industrial and office properties totalling approximately 20.5 million square feet.
FORWARD-LOOKING DISCLAIMER
Certain information in this news release contains forward-looking information within the meaning of applicable securities laws (also known as forward-looking statements) including, among others, statements made or implied relating to H&R's objectives, beliefs, plans, estimates, targets, projections and intentions and similar statements concerning anticipated future events, results, circumstances, performance or expectations that are not historical facts, including the statements made under the heading "Summary of Significant Q2 2026 Activity" including with respect to H&R's future plans and targets, the value of assets and liabilities held for sale, capitalization rates and cash flow models used to estimate fair values, the expected financial impact of the 200 Bouchard Final Lease Termination Payment on net operating income, Same-Property net operating income (cash basis), FFO and AFFO, expectations regarding future operating fundamentals, management's expectations regarding future distributions by the REIT, management's expectation to be able to meet all of the REIT's ongoing obligations, and statements relating to the Transaction, including the consideration to be paid to unitholders and the timing of and conditions to closing of the Transaction. Forward-looking statements generally can be identified by words such as "outlook", "objective", "may", "will", "expect", "intend", "estimate", "anticipate", "believe", "should", "plans", "project", "budget" or "continue" or similar expressions suggesting future outcomes or events. Such forward-looking statements reflect H&R's current beliefs and are based on information currently available to management.
Forward-looking statements are provided for the purpose of presenting information about management's current expectations and plans relating to the future, and readers are cautioned that such statements may not be appropriate for other purposes. These statements are not guarantees of future performance and are based on H&R's estimates and assumptions that are subject to risks, uncertainties and other factors including those risks and uncertainties described below under "Risks and Uncertainties" and those discussed in H&R's materials filed with the Canadian securities regulatory authorities from time to time, which could cause the actual results, performance or achievements of H&R to differ materially from the forward-looking statements contained in this news release. Material factors or assumptions that were applied in drawing a conclusion or making an estimate set out in the forward-looking statements include assumptions relating to the general economy, including debt markets continuing to provide access to capital at a reasonable cost; and assumptions concerning currency exchange and interest rates. Additional risks and uncertainties include, among other things, those related to: real property ownership; the current economic environment; tariffs and other international trade disputes; property valuations; credit risk and tenant concentration; lease rollover risk; interest rate and other debt-related risks; inflation risk; development risks; residential rental risk; capital expenditure risk; currency risk; liquidity risk; cyber security risk and breach of privacy or information security systems; artificial intelligence and related technologies; expanding social media vehicles; financing credit risk; ESG and climate change risk; public health crises; co-ownership interest in properties; business continuity; general uninsured losses; joint arrangement and investment risks; talent management and succession planning; potential acquisition, investment and disposition opportunities and joint venture arrangements; potential undisclosed liabilities associated with acquisitions; competition for real property investments; potential conflicts of interest; litigation and regulatory risk; Unit prices; availability of cash for distributions; credit ratings; ability to access capital; dilution; unitholder liability; redemption right; investment eligibility; debentures; statutory remedies; unitholder activism; tax risk; and additional tax risks applicable to the REIT and to unitholders. H&R cautions that these lists of factors, risks and uncertainties are not exhaustive. Although the forward-looking statements contained in this news release are based upon what H&R believes are reasonable assumptions, there can be no assurance that actual results will be consistent with these forward-looking statements.
Readers are also urged to examine H&R's materials filed with the Canadian securities regulatory authorities from time to time as they may contain discussions on risks and uncertainties which could cause the actual results and performance of H&R to differ materially from the forward-looking statements contained in this news release. All forward-looking statements in this news release are qualified by these cautionary statements. These forward-looking statements are made as of August 12, 2026 and the REIT, except as required by applicable Canadian law, assumes no obligation to update or revise them to reflect new information or the occurrence of future events or circumstances.
NON-GAAP MEASURES
The unaudited condensed consolidated financial statements of the REIT and related notes for the three and six months ended June 30, 2026 (the "REIT's Financial Statements") were prepared in accordance with IFRS Accounting Standards ("IFRS"). However, H&R's management uses a number of measures, including NAV per Unit, FFO, AFFO, FFO and AFFO per basic and diluted Unit, payout ratio as a % of FFO, payout ratio as a % of AFFO, debt to total assets at the REIT's proportionate share, debt to Adjusted EBITDA at the REIT's proportionate share, Same‐Property net operating income (cash basis) and the REIT's proportionate share, which do not have meanings recognized or standardized under IFRS or GAAP. These non‐GAAP measures and non‐GAAP ratios should not be construed as alternatives to financial measures calculated in accordance with GAAP. Further, H&R's method of calculating these supplemental non‐GAAP measures and ratios may differ from the methods of other real estate investment trusts or other issuers, and accordingly may not be comparable. H&R uses these measures to better assess H&R's underlying performance and provides these additional measures so that investors may do the same.
For information on the most directly comparable GAAP measures, composition of the measures, a description of how the REIT uses these measures and an explanation of how these measures provide useful information to investors, refer to the "Non‐GAAP Measures" section of the REIT's management's discussion and analysis as at and for the three and six months ended June 30, 2026 available at www.hr‐reit.com and on the REIT's profile on SEDAR+ at www.sedarplus.com, which is incorporated by reference into this news release.
FINANCIAL POSITION
The following table reconciles the REIT's Statement of Financial Position from the REIT's Financial Statements to the REIT's proportionate share (a non-GAAP measure):
June 30, 2026 | December 31, 2025 | |||||
(in thousands of Canadian dollars) | REIT's Financial Statements | Equity investments | REIT's | REIT's Financial Statements | Equity investments | REIT's |
Assets | ||||||
Real estate assets | ||||||
Investment properties | $6,042,177 | $1,115,405 | $7,157,582 | $6,370,453 | $1,053,283 | $7,423,736 |
Properties under development | 475,524 | 213,637 | 689,161 | 785,184 | 240,930 | 1,026,114 |
6,517,701 | 1,329,042 | 7,846,743 | 7,155,637 | 1,294,213 | 8,449,850 | |
Equity accounted investments | 514,265 | (514,265) | — | 484,702 | (484,702) | — |
Assets classified as held for sale | 735,690 | 37,547 | 773,237 | 1,142,900 | — | 1,142,900 |
Other assets | 290,598 | 8,418 | 299,016 | 272,910 | 6,979 | 279,889 |
Cash and cash equivalents | 59,129 | 15,809 | 74,938 | 52,137 | 6,503 | 58,640 |
$8,117,383 | $876,551 | $8,993,934 | $9,108,286 | $822,993 | $9,931,279 | |
Liabilities and Unitholders' Equity | ||||||
Liabilities | ||||||
Debt | $2,508,705 | $848,403 | $3,357,108 | $3,501,891 | $800,889 | $4,302,780 |
Exchangeable units | 168,784 | — | 168,784 | 157,968 | — | 157,968 |
Deferred revenue | 838,898 | — | 838,898 | 862,139 | — | 862,139 |
Deferred tax liability | 188,233 | — | 188,233 | 212,781 | — | 212,781 |
Accounts payable and accrued liabilities | 223,878 | 28,148 | 252,026 | 237,789 | 22,104 | 259,893 |
3,928,498 | 876,551 | 4,805,049 | 4,972,568 | 822,993 | 5,795,561 | |
Unitholders' equity | 4,188,885 | — | 4,188,885 | 4,135,718 | — | 4,135,718 |
$8,117,383 | $876,551 | $8,993,934 | $9,108,286 | $822,993 | $9,931,279 | |
DEBT TO ADJUSTED EBITDA AT THE REIT'S PROPORTIONATE SHARE
The following table provides a reconciliation of Debt to Adjusted earnings before interest, taxes, depreciation and amortization ("Adjusted EBITDA") at the REIT's proportionate share (a non-GAAP ratio):
June 30 | December 31 | |
(in thousands of Canadian dollars) | 2026 | 2025 |
Debt per the REIT's Financial Statements(1) | $2,508,705 | $3,501,891 |
Debt - REIT's proportionate share of equity accounted investments(1) | 848,403 | 800,889 |
Debt at the REIT's proportionate share(1) | 3,357,108 | 4,302,780 |
H&R's share of ECHO's debt classified within assets held for sale(1)(2) | — | 361,423 |
Total Debt(1) | 3,357,108 | 4,664,203 |
(Figures below are for the trailing 12 months) | ||
Net loss per the REIT's Financial Statements | (570,911) | (791,564) |
Net (income) loss from equity accounted investments (within equity accounted investments) | 89 | (57) |
Finance costs - operations | 224,989 | 253,893 |
Fair value adjustments on financial instruments and real estate assets | 1,101,813 | 1,324,237 |
Loss on sale of real estate assets, net of related costs | 10,458 | 748 |
Loss on foreign exchange (within equity accounted investments) | 28 | 879 |
Income tax recovery | (193,694) | (182,420) |
Non-controlling interest | 616 | 1,171 |
Adjustments: | ||
The Bow and 100 Wynford non-cash rental income adjustments | (94,974) | (94,559) |
Straight-lining of contractual rent | 2,929 | (13,898) |
IFRIC 21 - realty tax adjustment | (9,907) | — |
Fair value adjustment to unit-based compensation | 1,774 | 3,168 |
Adjusted EBITDA at the REIT's proportionate share | $473,210 | $501,598 |
Debt to Adjusted EBITDA at the REIT's proportionate share(1) | 7.1x | 9.3x |
(1) | Debt includes mortgages payable, debentures payable, unsecured term loans, lines of credit and liabilities classified as held for sale. |
(2) | For the year ended December 31, 2025, H&R included ECHO's debt classified within assets held for sale within Total Debt. |
RESULTS OF OPERATIONS
The following table reconciles the REIT's Results of Operations from the REIT's Financial Statements to the REIT's proportionate share (a non-GAAP measure):
Three months ended June 30, 2026 | Three months ended June 30, 2025 | |||||
(in thousands of Canadian dollars) | REIT's Financial Statements | Equity investments | REIT's | REIT's Financial Statements | Equity investments | REIT's |
Rentals from investment properties | $169,780 | $22,041 | $191,821 | $204,011 | $41,571 | $245,582 |
Property operating costs | (52,770) | (6,101) | (58,871) | (60,185) | (9,374) | (69,559) |
Net operating income | 117,010 | 15,940 | 132,950 | 143,826 | 32,197 | 176,023 |
Net income (loss) from equity accounted investments | 11,235 | (11,235) | — | 26,780 | (26,793) | (13) |
Finance costs - operations | (39,918) | (6,966) | (46,884) | (51,210) | (12,102) | (63,312) |
Finance income | 5,610 | 404 | 6,014 | 2,731 | 536 | 3,267 |
Trust expenses, net | (6,643) | (32) | (6,675) | (3,489) | (1,674) | (5,163) |
Fair value adjustment on financial instruments | (19,825) | 6 | (19,819) | (8,018) | (17) | (8,035) |
Fair value adjustment on real estate assets | (44,845) | 1,915 | (42,930) | (280,656) | 9,145 | (271,511) |
Gain (loss) on sale of real estate assets, net of related costs | (63) | — | (63) | 292 | (27) | 265 |
Loss on foreign exchange | — | — | — | — | (850) | (850) |
Transaction costs | — | (2) | (2) | (8,669) | — | (8,669) |
Net income (loss) before income taxes and non-controlling interest | 22,561 | 30 | 22,591 | (178,413) | 415 | (177,998) |
Income tax (expense) recovery | 14,574 | (29) | 14,545 | 12,043 | (89) | 11,954 |
Net income (loss) before non-controlling interest | 37,135 | 1 | 37,136 | (166,370) | 326 | (166,044) |
Non-controlling interest | — | (1) | (1) | — | (326) | (326) |
Net income (loss) | 37,135 | — | 37,135 | (166,370) | — | (166,370) |
Other comprehensive income (loss): | ||||||
Items that are or may be reclassified subsequently to net income (loss) | 73,057 | — | 73,057 | (261,892) | — | (261,892) |
Total comprehensive income (loss) attributable to unitholders | $110,192 | $— | $110,192 | ($428,262) | $— | ($428,262) |
RESULTS OF OPERATIONS
The following table reconciles the REIT's Results of Operations from the REIT's Financial Statements to the REIT's proportionate share (a non-GAAP measure):
Six months ended June 30, 2026 | Six months ended June 30, 2025 | |||||
(in thousands of Canadian dollars) | REIT's Financial Statements | Equity investments | REIT's | REIT's Financial Statements | Equity investments | REIT's |
Rentals from investment properties | $354,033 | $51,287 | $405,320 | $409,650 | $83,137 | $492,787 |
Property operating costs | (151,154) | (15,473) | (166,627) | (182,861) | (24,096) | (206,957) |
Net operating income | 202,879 | 35,814 | 238,693 | 226,789 | 59,041 | 285,830 |
Net income (loss) from equity accounted investments | 3,971 | (4,075) | (104) | 16,698 | (16,657) | 41 |
Finance costs - operations | (83,117) | (15,688) | (98,805) | (103,219) | (24,490) | (127,709) |
Finance income | 10,868 | 835 | 11,703 | 5,921 | 758 | 6,679 |
Trust expenses, net | (13,273) | (971) | (14,244) | (10,726) | (3,719) | (14,445) |
Fair value adjustment on financial instruments | (16,547) | 95 | (16,452) | (30,123) | (113) | (30,236) |
Fair value adjustment on real estate assets | (123,898) | (15,556) | (139,454) | (333,354) | (14,740) | (348,094) |
Gain (loss) on sale of real estate assets, net of related costs | (8,954) | (2) | (8,956) | (811) | 1,565 | 754 |
Gain (loss) on foreign exchange | — | 1 | 1 | — | (850) | (850) |
Transaction costs | — | (257) | (257) | (8,669) | — | (8,669) |
Net income (loss) before income taxes and non-controlling interest | (28,071) | 196 | (27,875) | (237,494) | 795 | (236,699) |
Income tax (expense) recovery | 30,336 | (64) | 30,272 | 19,106 | (108) | 18,998 |
Net income (loss) before non-controlling interest | 2,265 | 132 | 2,397 | (218,388) | 687 | (217,701) |
Non-controlling interest | — | (132) | (132) | — | (687) | (687) |
Net income (loss) | 2,265 | — | 2,265 | (218,388) | — | (218,388) |
Other comprehensive income (loss): | ||||||
Items that are or may be reclassified subsequently to net income (loss) | 129,412 | — | 129,412 | (261,954) | — | (261,954) |
Total comprehensive income (loss) attributable to unitholders | $131,677 | $— | $131,677 | ($480,342) | $— | ($480,342) |
SAME-PROPERTY NET OPERATING INCOME (CASH BASIS)
The following table reconciles net operating income per the REIT's Financial Statements to Same-Property net operating income (cash basis) (a non-GAAP measure):
Three months ended June 30 | Six months ended June 30 | |||||
(in thousands of Canadian dollars) | 2026 | 2025 | Change | 2026 | 2025 | Change |
Rentals from investment properties | $169,780 | $204,011 | ($34,231) | $354,033 | $409,650 | ($55,617) |
Property operating costs | (52,770) | (60,185) | 7,415 | (151,154) | (182,861) | 31,707 |
Net operating income per the REIT's Financial Statements | 117,010 | 143,826 | (26,816) | 202,879 | 226,789 | (23,910) |
Adjusted for: | ||||||
Net operating income from equity accounted investments | 15,940 | 32,197 | (16,257) | 35,814 | 59,041 | (23,227) |
Straight-lining of contractual rent at the REIT's proportionate share | 12,526 | (3,861) | 16,387 | 9,308 | (7,519) | 16,827 |
Realty taxes in accordance with IFRIC 21 at the REIT's proportionate share | (10,403) | (16,820) | 6,417 | 22,467 | 32,374 | (9,907) |
Net operating income (cash basis) from Transactions at the REIT's proportionate share | (28,159) | (61,969) | 33,810 | (73,556) | (123,908) | 50,352 |
Same-Property net operating income (cash basis) | $106,914 | $93,373 | $13,541 | $196,912 | $186,777 | $10,135 |
NAV PER UNIT
The following table reconciles Unitholders' equity per Unit to NAV per Unit (a non-GAAP ratio):
Unitholders' Equity per Unit and NAV per Unit | June 30 | December 31 |
(in thousands except for per Unit amounts) | 2026 | 2025 |
Unitholders' equity | $4,188,885 | $4,135,718 |
Exchangeable units | 168,784 | 157,968 |
Deferred tax liability | 188,233 | 212,781 |
Total | $4,545,902 | $4,506,467 |
Units outstanding | 264,637 | 264,558 |
Exchangeable units outstanding | 15,372 | 15,442 |
Total | 280,009 | 280,000 |
Unitholders' equity per Unit(1) | $15.83 | $15.63 |
NAV per Unit | $16.23 | $16.09 |
(1) | Unitholders' equity per Unit is calculated by dividing unitholders' equity by Units outstanding. |
FUNDS FROM OPERATIONS AND ADJUSTED FUNDS FROM OPERATIONS
The following table reconciles net income (loss) per the REIT's Financial Statements to FFO and AFFO (non-GAAP measures):
FFO AND AFFO | Three Months ended June 30 | Six months ended June 30 | ||
(in thousands of Canadian dollars except per Unit amounts) | 2026 | 2025 | 2026 | 2025 |
Net income (loss) per the REIT's Financial Statements | $37,135 | ($166,370) | $2,265 | ($218,388) |
Realty taxes in accordance with IFRIC 21 | (9,834) | (15,504) | 21,302 | 29,850 |
FFO adjustments from equity accounted investments | (1,177) | (8,689) | 19,421 | 18,421 |
Exchangeable unit distributions | 2,313 | 2,613 | 4,629 | 5,227 |
Provision for expected credit loss | — | — | — | 268 |
Fair value adjustments on financial instruments and real estate assets | 64,670 | 288,674 | 140,445 | 363,477 |
Fair value adjustment to unit-based compensation | 2,038 | 1,633 | 1,753 | 3,147 |
(Gain) loss on sale of real estate assets, net of related costs | 63 | (292) | 8,954 | 811 |
Transaction costs | — | 8,669 | — | 8,669 |
Deferred income tax recovery applicable to U.S. Holdco | (14,996) | (12,535) | (31,403) | (20,030) |
Incremental leasing costs | 612 | 572 | 1,225 | 1,161 |
The Bow and 100 Wynford non-cash rental income and accretion | (11,739) | (10,967) | (23,241) | (21,711) |
FFO | $69,085 | $87,804 | $145,350 | $170,902 |
Straight-lining of contractual rent | 13,103 | (3,355) | 10,177 | (6,967) |
Rent amortization of tenant inducements | 345 | 1,129 | 1,156 | 2,279 |
Capital expenditures | (6,969) | (9,849) | (12,579) | (20,206) |
Leasing expenses and tenant inducements | (625) | (598) | (1,211) | (1,255) |
Incremental leasing costs | (612) | (572) | (1,225) | (1,161) |
AFFO adjustments from equity accounted investments | (810) | (1,179) | (2,652) | (2,199) |
AFFO | $73,517 | $73,380 | $139,016 | $141,393 |
Basic and diluted weighted average number of Units and exchangeable units (in thousands of Units)(1) | 280,009 | 279,990 | 280,006 | 279,990 |
FFO per basic and diluted Unit | $0.247 | $0.314 | $0.519 | $0.610 |
AFFO per basic and diluted Unit | $0.263 | $0.262 | $0.496 | $0.505 |
Cash distributions per Unit | $0.150 | $0.150 | $0.300 | $0.300 |
Payout ratio as a % of FFO | 60.7 % | 47.8 % | 57.8 % | 49.2 % |
Payout ratio as a % of AFFO | 57.0 % | 57.3 % | 60.5 % | 59.4 % |
(1) | For the three and six months ended June 30, 2026, included in the weighted average and diluted weighted average number of Units are exchangeable units of 15,433,221 and 15,437,409, respectively. For the three and six months ended June 30, 2025, included in the weighted average and diluted weighted average number of Units are exchangeable units of 17,424,186 and 17,448,495, respectively. |
Additional information regarding H&R REIT is available at www.hr-reit.com and on www.sedarplus.com.
SOURCE H&R Real Estate Investment Trust

